This is the code Im using now:
[$dll(perf,1,1x6#u#102#5#0#100#\Processor(0)\% Processor Time,Core0)][$dll(perf,1,1x6#u#102#5#0#100#\Processor(1)\% Processor Time,Core1)]
As you can see, Ive got it labeled for Core0 and Core1. However, the graph it creates shows the same thing. Its late, and I know Im probably overlooking a tiny mistake. Can anyone please point it out?
Our new official repo is on github
LCD Smartie version 5.6 is released!
Download it now: https://github.com/LCD-Smartie/LCDSmartie/releases
LCD Smartie version 5.6 is released!
Download it now: https://github.com/LCD-Smartie/LCDSmartie/releases
Perf Displaying Two Cores
Moderators: _X7JAY7X_, caesar, IFR, mattcro, limbo
-
rfryar
- Posts: 36
- Joined: July 17th, 2007, 2:12 pm
- Contact:
You are using the tiny graph method of the PERF dll. The graph use listed above each use 6 characters and most LCDs only have 8 custom characters available. So each graph is using the same bank of custom characters and you only see one graph.
If you happen to own a DX160 LCD then you can use my driver and custom character DLL to get two perf tiny graphs displayed. See this site for pictures of it in action. http://lcdsmartie.fryar.org/DX160CharMapper.php
Rick
If you happen to own a DX160 LCD then you can use my driver and custom character DLL to get two perf tiny graphs displayed. See this site for pictures of it in action. http://lcdsmartie.fryar.org/DX160CharMapper.php
Rick
-
SpikedCola
- Posts: 12
- Joined: April 27th, 2007, 5:32 am
-
mattcro
- Forum Supporter
- Posts: 590
- Joined: March 8th, 2006, 1:58 pm
- Location: Scotland
For most LCDs, you'll have to make do with two 1x4 tiny graphs (8 characters total). I think if you have big graphs, you can have any size and any number of graphs. It's a fundamental limitation of the alpha-numeric LCD modules. VFD's are mostly the same.
edit: You posted as I was typing, Cola. You should be able to do two small graphs for dual-core performance. Depending on how the processors are being used, the load may be similar on both so the graphs might look the same or nearly the same anyway. You can try forcing an app to use only 1 core to test the graphs.
edit: You posted as I was typing, Cola. You should be able to do two small graphs for dual-core performance. Depending on how the processors are being used, the load may be similar on both so the graphs might look the same or nearly the same anyway. You can try forcing an app to use only 1 core to test the graphs.
-
SpikedCola
- Posts: 12
- Joined: April 27th, 2007, 5:32 am
I set up VirtualDubMod to recompress an uncompressed AVI, set the affinity to Core 0, and made each graph 1x2 just incase, and it still shows the exact same thing. ahwell. any mod to show the usage of cores 0 and 1, instead of just the total? I tried the other perf plugin, but it would show usage as like... 24.687365% and I dont need that many decimal places.
-
SpikedCola
- Posts: 12
- Joined: April 27th, 2007, 5:32 am
One other question; Ive got my free ram and cpu temps set up like this:
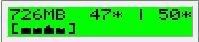
(Id like to put the usage under the temp, by the way)
However, when I have 1000mb or more of free ram, my display gets cut off:

If I remove the double-space, it fits:

But looks silly with <1000mb of ram:

How can I have a single space with >1000mb and a double space with <1000mb?
(Id like to put the usage under the temp, by the way)
However, when I have 1000mb or more of free ram, my display gets cut off:
If I remove the double-space, it fits:
But looks silly with <1000mb of ram:
How can I have a single space with >1000mb and a double space with <1000mb?
-
rfryar
- Posts: 36
- Joined: July 17th, 2007, 2:12 pm
- Contact:
-
SpikedCola
- Posts: 12
- Joined: April 27th, 2007, 5:32 am
-
fozi
- Plugin Author
- Posts: 16
- Joined: November 1st, 2006, 2:09 am
-
mattcro
- Forum Supporter
- Posts: 590
- Joined: March 8th, 2006, 1:58 pm
- Location: Scotland
As a quick check on the dual core processor usage, try using the numeric output of perf.dll instead of graphs, and see if they are still the same.
You can also look at the stats in the Performance system utility (maybe also task manager).
Code: Select all
Core 0: $dll(perf,4,20,\Processor(0)\% Processor Time)%
Core 1: $dll(perf,4,20,\Processor(1)\% Processor Time)%-
SpikedCola
- Posts: 12
- Joined: April 27th, 2007, 5:32 am
The % usage works properly, I might end up using that and just use a "total" bar graph
fozi, if my original perf statements are incorrect, can you please correct what Ive posted?
[$dll(perf,1,1x2#u#102#5#0#100#\Processor(0)\% Processor Time,test1)]
[$dll(perf,1,1x2#u#102#5#0#100#\Processor(1)\% Processor Time,test2)]
Thats what Im using now. Ive set it to 1x2 just to make sure the max. amount of custom chars arent being used up. Also, I was under the influence that the name (test1/2) was only a name, and doesnt actually affect the graph itself. Is there something Im missing?
Also, does anyone know of a program that will just create cpu usage? This way I can set it's affinity to CPU 1 or 2 in the task manager, to increase the usage, so it can be seen during testing
-
fozi
- Plugin Author
- Posts: 16
- Joined: November 1st, 2006, 2:09 am
oops.. 8-(
Sorry for misreading your first post. Your statements are correct.
I pasted your configuration into my machine and with the exception of having to change the character to "1" everything worked fine. The 102 character just showed up as dots on my LCD.
I'm running a 2 socket dual core machine so I have 4 cores to test with and all 4 showed different graphs based on CPU load.
For testing I just fired up FS2004 (single threaded) and pushed it around between processors with CPU affinity in task manager. Any single threaded game that you can alt-tab out of without pausing should work the same.
Here's a direct cut from my config.ini.
Text01="$dll(perf,1,1x6#u#1#5#0#100#\Processor(0)\% Processor Time,Core0)"
Text02="$dll(perf,1,1x6#u#1#5#0#100#\Processor(1)\% Processor Time,Core1)"
Text03="$dll(perf,1,1x6#u#1#5#0#100#\Processor(2)\% Processor Time,Core2)"
Text04="$dll(perf,1,1x6#u#1#5#0#100#\Processor(3)\% Processor Time,Core3)"
Hope this helps
-fozi
-
mattcro
- Forum Supporter
- Posts: 590
- Joined: March 8th, 2006, 1:58 pm
- Location: Scotland
See the end of this thread: http://forums.lcdsmartie.org/viewtopic. ... ht=counter
The counter names in the plugin examples are for English Windows installations. You need to specify the counter names in your own language, which you can find in the Performance utility.
The counter names in the plugin examples are for English Windows installations. You need to specify the counter names in your own language, which you can find in the Performance utility.
-
mattcro
- Forum Supporter
- Posts: 590
- Joined: March 8th, 2006, 1:58 pm
- Location: Scotland
Excuse me resurrecting this thread, but...
I've finally got around to trying two cpu graphs for a dual-core machine, and came up against the tinygraph issue. I planned to have dual 1x4 tinygraphs for cpu usage, but as SpikedCola found, both graphs show the same thing. I guess both graphs use the same 4 custom characters, so the first graph on the screen gets overwritten with the second graph regardless of how many characters they use.
It would be nice to be able to have two independent 4-character tinygraphs, or any combo of independent graphs up to a total of 8 custom chars. This could be tricky to program, but would be useful for monitoring dual-core cpu load, or cpu and memory usage etc without taking up an entire screen for the graphs.
Any chance of an update with multi-tinygraph support, please?
-
caesar
- Forum Supporter
- Posts: 734
- Joined: October 15th, 2005, 10:39 am
- Location: Romania
- Contact:
-
EvylRat
- Posts: 53
- Joined: September 26th, 2007, 5:33 pm
- Contact: